Background
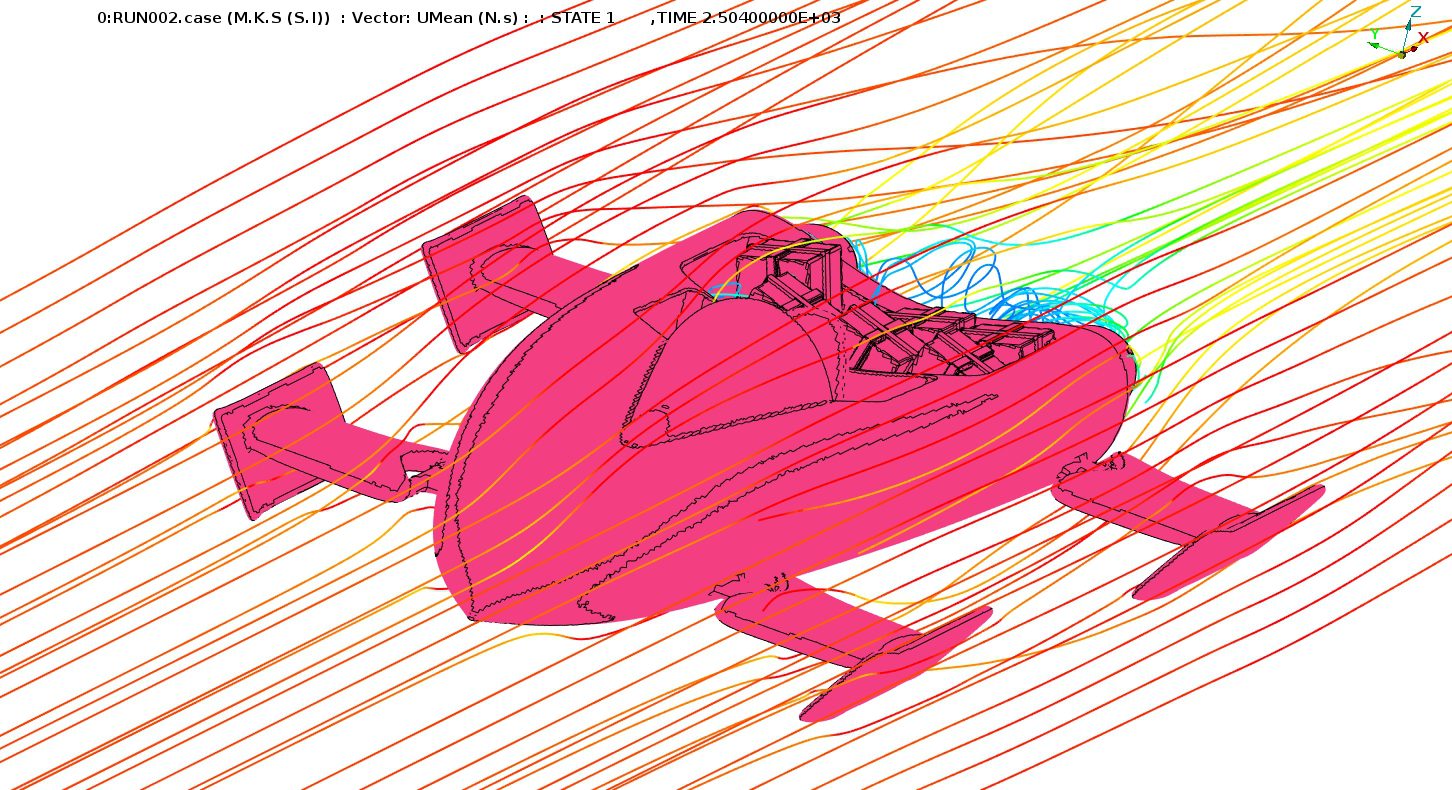
It’s the most wonderful time of the year and kids (and some adults) are eagerly waiting for Santa to deliver their presents. As you watch the Santa Trackers, you’re probably wondering if Dasher or Rudolph could fly a little quicker so that the presents get under your tree even faster.
This version of Santa’s sleigh, named the Jingle Jet, is designed and drawn by Mikael Sedlacek. It’s equipped with two jet turbo engines; meaning that this sleigh does not require the services of Santa’s reindeer and they get the night off. The Jingle Jet is designed with an aerodynamic body so that it can glide through the sky.
Technical Length of the Jingle Jet:
- Length: 17.55 ft
- Width (Parked Config): 11.93 ft
- Height: 4.92 ft
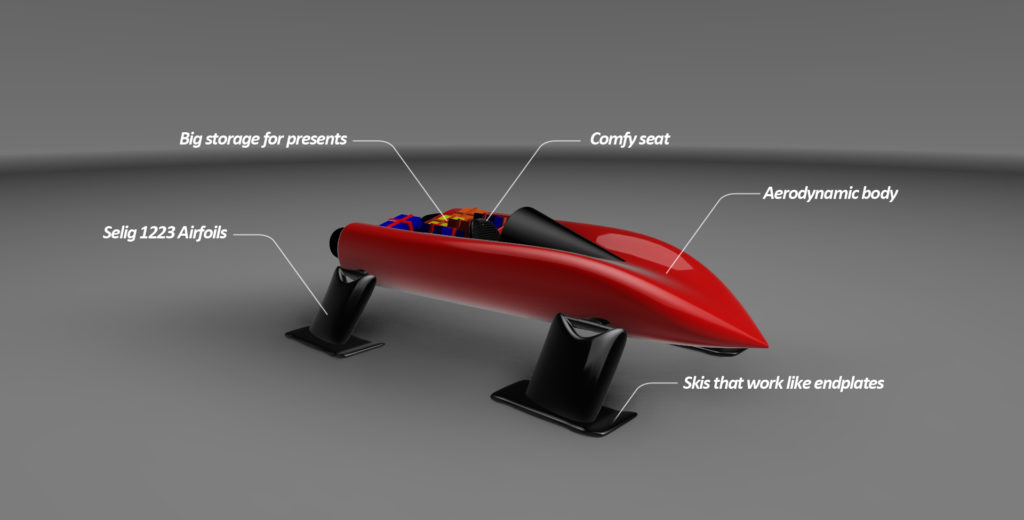

Breakdown of Santa’s Jet Turbo sleigh [1]
Run Conditions
This simulation of the Jingle Jet was solved with a flow velocity of 150 mph at an altitude of 5,000 ft.
Run Stats
- Vehicle CAD file [2] was prepped and processed via Beta CAE’s ANSA v18.10.
- Meshed with snappyHexMesh (part of OpenFOAM)
- Vehicle was meshed and solved on 48 cores
- Mesh Size: 19.7 million cells
- Solved using TotalSim’s version of OpenFOAM (simplec solver)
- Jets off and the vehicle is in glide mode
Analysis
Note: The geometry file was drawn by an enthusiast and the numbers/plots below may not accurately depict the vehicle.
Aerodynamic Forces


The simulation reported that the Jingle Jet generated 560.6 lb of drag and 802 lb of lift. Nondimensionalization of the forces yield a CD of 0.35 and 0.48 for CL. Just to compare, a typical car has a Cd of ~0.30 and a model rocket has a Cd of 0.75 [3].
The aerodynamic efficiency, which is the ratio of lift to drag (L/D), is 1.36. Typically, a higher L/D is favorable and often a key metric for aircraft designers. A higher L/D is typically associated with longer endurance or a smaller glide slope angle. Typical L/D ratios include 4 for a helicopter, 15-20 for commercial aircraft and 2.5 for a gliding wingsuit [4].
Cp Plots
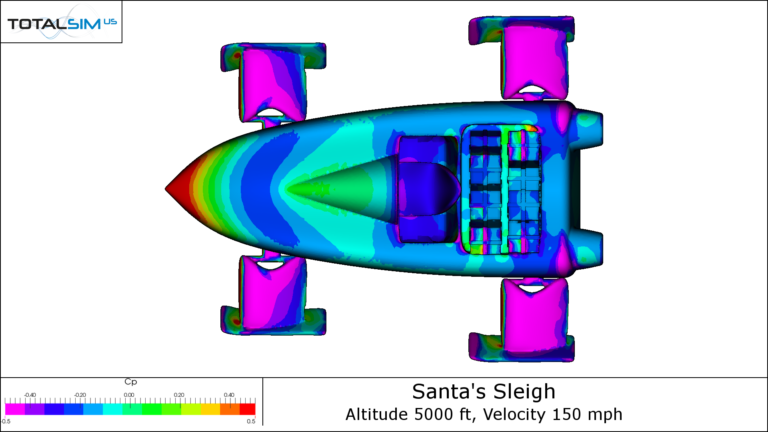
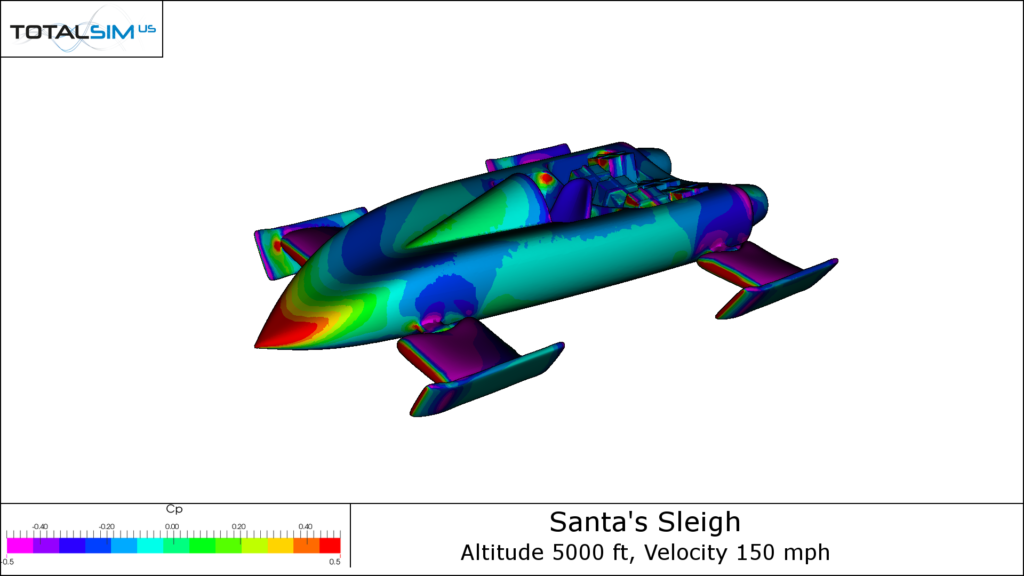
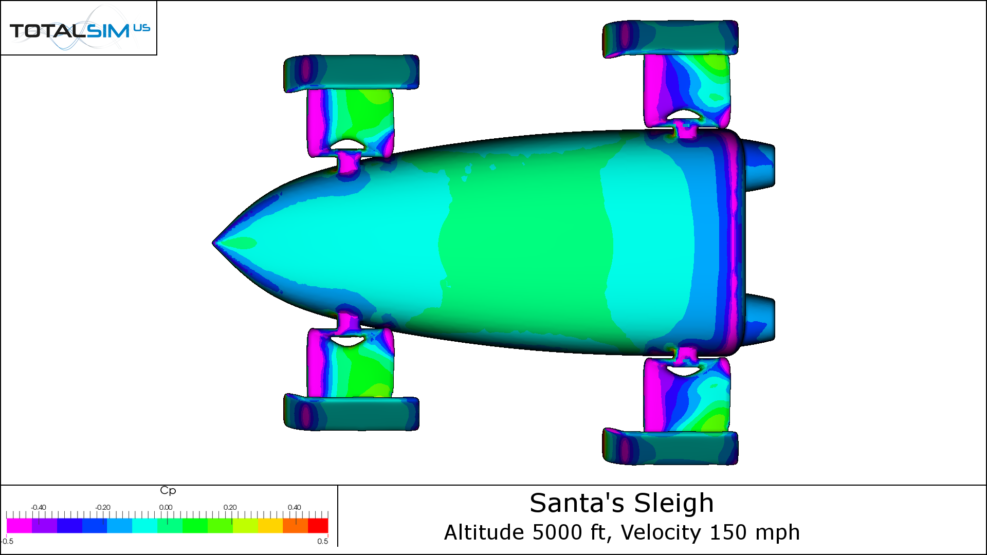
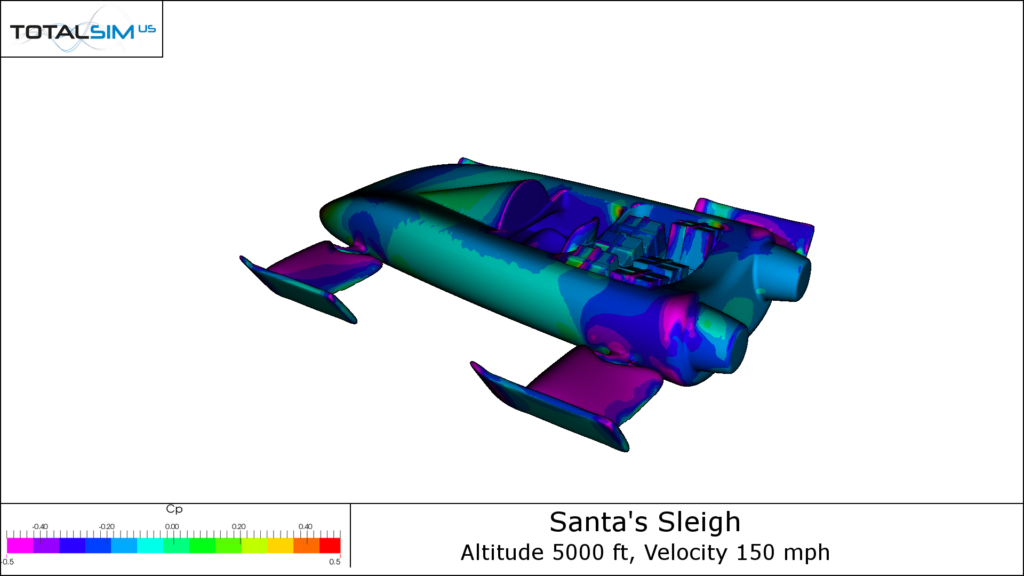
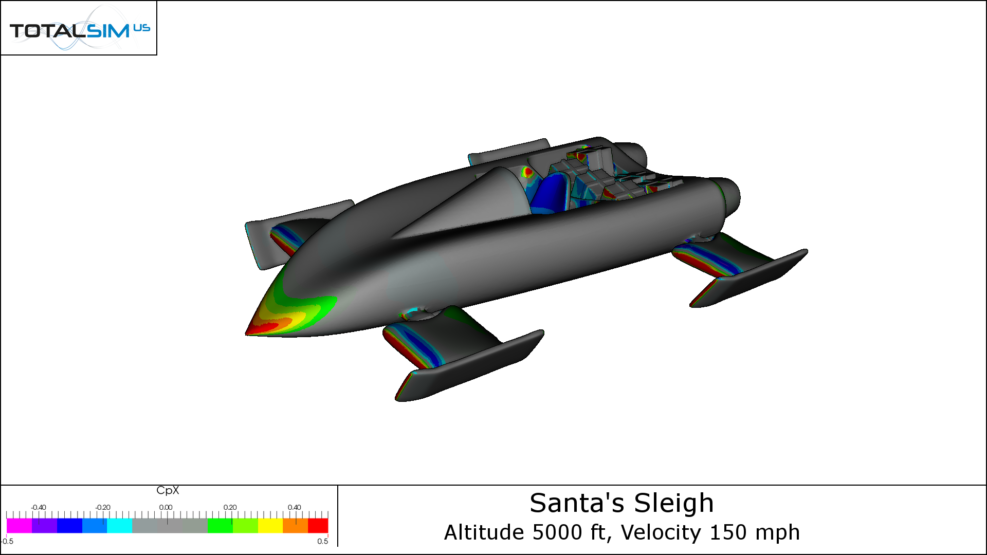
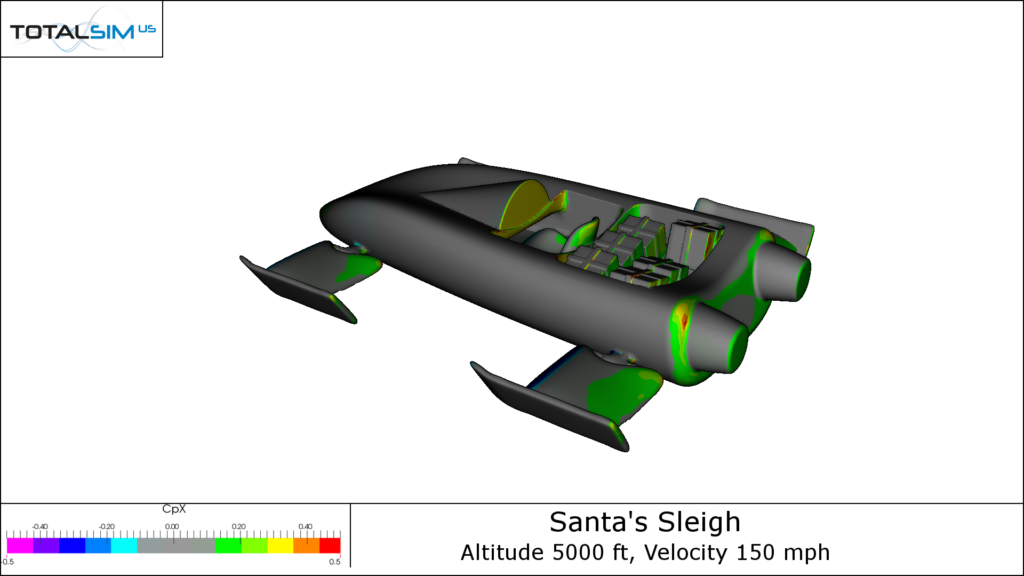
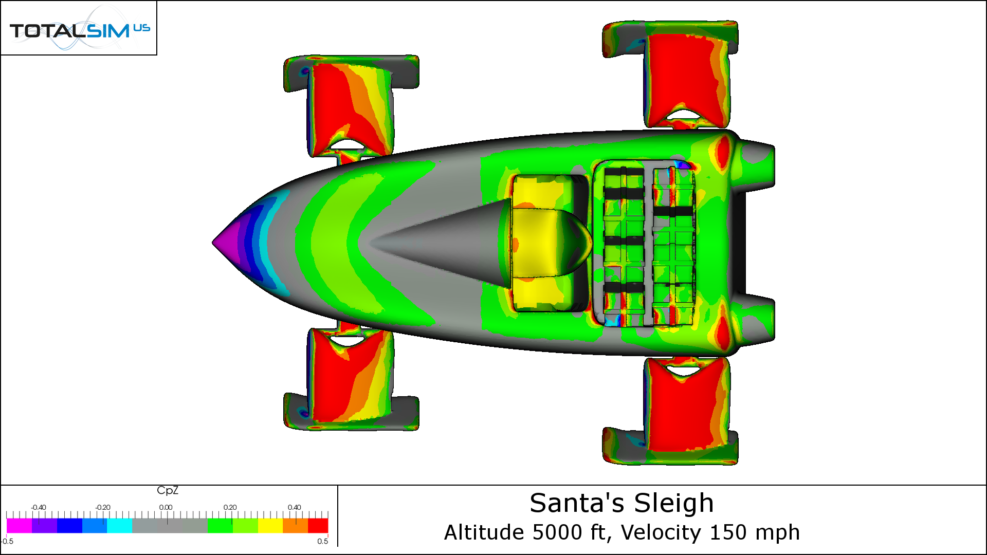
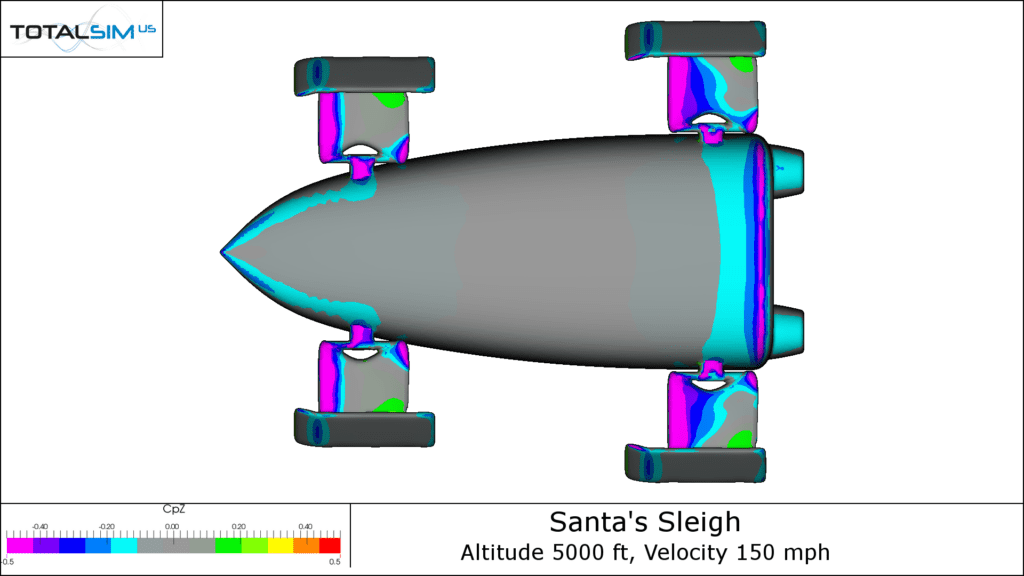
By looking at the pressure surface plots, we can understand how these forces are being created. Warm colors show regions of high pressure and cool colors show regions of low pressure. By isolating pressure in the x direction (longitudinally) and the z-direction (vertically), we can see the influences of drag and lift on the Jingle Jet.




CpX Plots
As expected, the Jingle Jet’s sleeker aerodynamic body shows that there is little in the way of drag production. Stagnation pressure drag is seen on the nose and at the leading edges of the landing gear arms. The gear arms show regions of thrust where the flow accelerates over the upper surface, which is expected for a highly cambered airfoil like the Selig 1223. Base drag can be seen on the rear face of the Jingle Jet as well as on the dashboard. Interestingly, the low pressure region created by the backward facing surfaces of the dashboard is imprinted on the seat, making it look as though the seat is producing thrust.


CpZ Plots
The upper surface of the Jingle Jet is mostly lift production except for the region around the nose. This is because the nose slopes downward and the stagnation pressure forces this region to push down on the vehicle. The underbody seems to be producing a fair amount of downforce and part of this stems from the flow accelerating around to the lower body. The low pressure behind the rear of the vehicle appears to be responsible for the downforce generated near the back.


Lift X-Ray
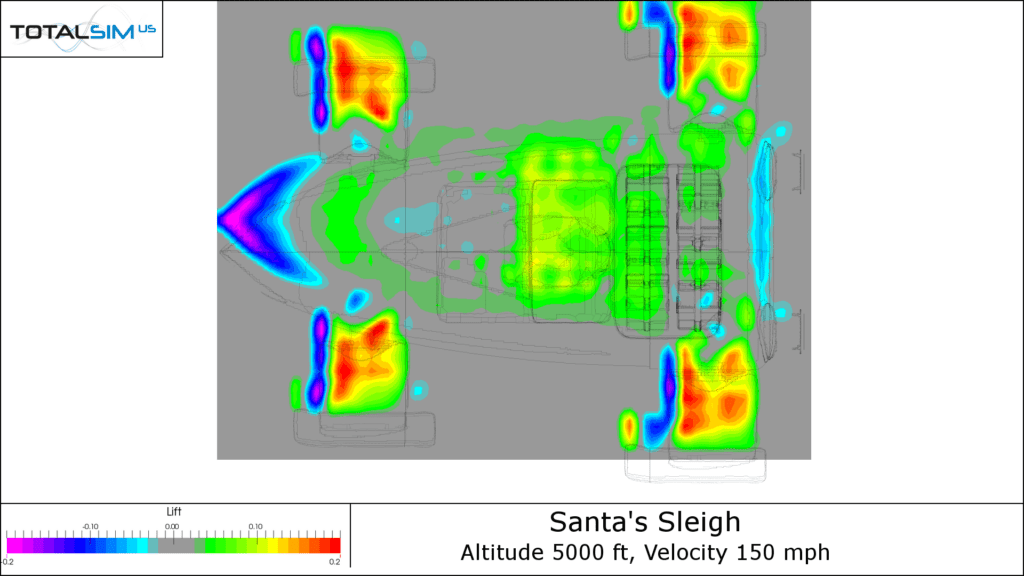
This frog-like image is a lift x-ray plot that shows a top view of the Jingle Jet and depicts where lift is created on the sleigh. From the above plot, we can see lift created at the body as well as the skis. The negative lift created at the nose is consistent with the CpZ plots we saw above. The region of downforce on the nose, coupled with the general lift of the rest of the body, implies that the Jingle Jet has a very nose down pitching moment even in standard cruise condition.

Some Christmas Math
Consider the aerodynamic lift created on the Jingle Jet at this flying condition is 802 lbs of lift – a pretty decent amount. In order to maintain steady level flight, the 802 lbs of lift would need to be equal to the combined weight of the vehicle, plus its payload.
Now, let’s calculate the amount of weight expected to carry all the presents in one go. At roughly two billion people in the world under the age of 18, only about 15% of them (300 million kids) are part of cultures that expect deliveries from Santa. Of those children, assuming an equal distribution between the ages of 18, mostly kids between the ages of 2 – 12 request Christmas presents from Santa. This puts the total to 167 million children. Counting out a 20% reduction of kids on the naughty list, and a subsequent 5% who request intangible gifts, Santa has to haul a payload fit for 126 million children.
Suppose Santa’s production house hit a snafu this past year and each child is only getting a single lego block for Christmas. At an average weight of 1.152g/lego block, Santa’s payload comes to a whopping 321,700 lbs. For a more generous estimate, if each child gets a 200-piece set, then poor Santa needs to haul 64.3 million pounds this Christmas.
As a comparison, an Airbus A380 can carry a payload of roughly 380,000 lbs. At 1 lego block per child, Santa could get the job done with an A380, but certainly not with the Jingle Jet in its current form. If the Jingle Jet were scaled up to the size of an A380, the lift produced by the jet could easily carry the payload, but that would be neglecting the weight of the jet itself, power required and fuel.
Concluding Remarks
A quick CFD analysis of the Jingle Jet demonstrates where the aerodynamic lift and drag are coming from on the body of the vehicle. Some quick math shows that Santa has an enormous task ahead of him later this month, and the Jingle Jet would need some re-thinking to carry all of the kids’ presents in a single delivery run. Of course this is mostly inside the box thinking, and we all know Santa has a few tricks up his sleeve get the job done.
Credits
[1] Photo retrieved from Mikael Sedlacek
[2] Vehicle drawn by Mikael Sedlacek
[3] Typical Cd values retrieved from https://en.wikipedia.org/wiki/Drag_coefficient
[4] Typical L/D ratios retrieved from https://en.wikipedia.org/wiki/Lift-to-drag_ratio

